How SharePoint 2013 Ranking models work
March 29, 2013 12 Comments
Introduction
Think of search as a two phase process, firstly search engine identifies documents that match query, secondly it performs ranking to predicts relevancy of each document. Typically search engines calculate rank taking into account many different things including attributes of document, importance of query terms, user clicks and so on – all of them are called ranking features.
Let’s review SharePoint 2013 ranking models in details : which features do they include, how it works and where it can be configured.
A list of available ranking models can be obtains using following commands in powershell:
(pay attention that in 2nd line there should be NO $ near -Level ssa, MSDN example contains this typo (http://technet.microsoft.com/en-us/library/ff607990.aspx)
$ssa = Get-SPEnterpriseSearchServiceApplication -Identity "Search Service Application"
$owner = Get-SPEnterpriseSearchOwner -Level ssa
$models = Get-SPEnterpriseSearchRankingModel –SearchApplication $ssa -Owner $owner
$models
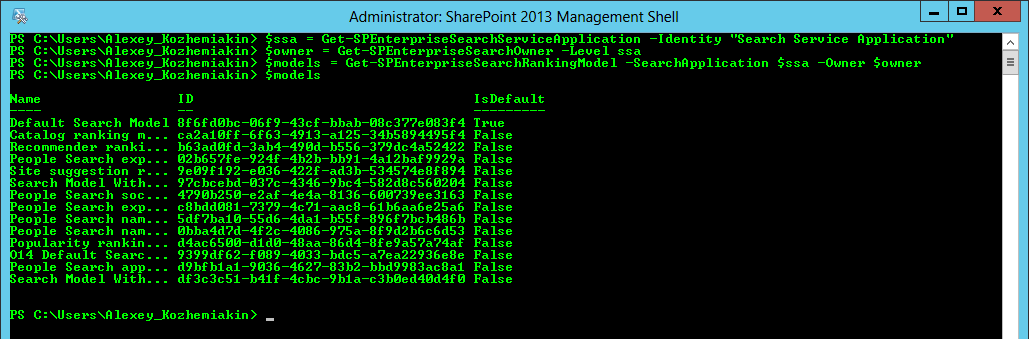
Here’s a list of available ranking models:
- Default Ranking Model
- Catalog ranking Model
- Recommender ranking model
- People Search expertise social distance ranking model
- People Search name social distance ranking model
- People Search name ranking model
- Popularity ranking model
- People search application ranking model
- People Search social distance model
- People Search expertise ranking model
- Site Suggestion ranking model
- Search model With Boosted Minspan
- O14 Default ranking model
- Search Model Without Minspan
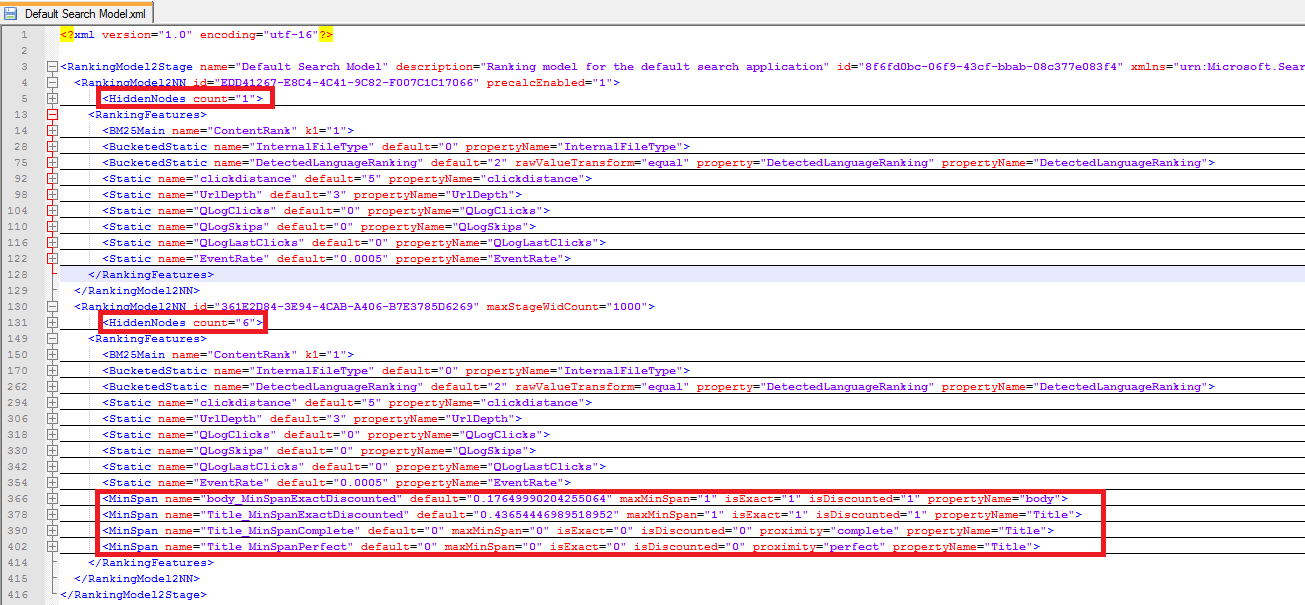
Let’s export first model to XML in order to examine it more closely.
$models[0].RankingModelXML > "c:\Default Search Model.xml"
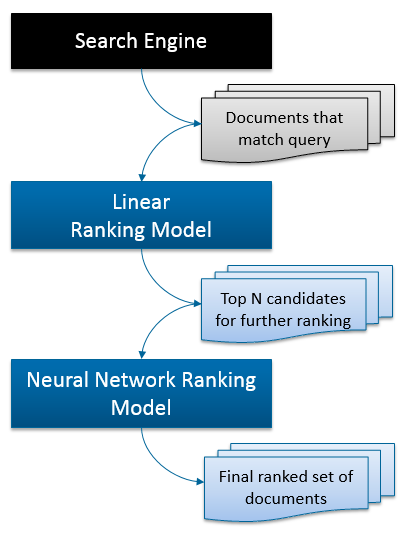
Ranking models in SharePoint 2013 can be a combination of several ranking models. Default ranking model is composed of 1st stage – Linear ranking model (HiddenNodes=1) which produces a limited set of candidates (maxStageWidCount=1000) for 2nd stage – Neural Network (HiddenNodes=6).
“Why does it have two stages?”
The reason for this is – performance optimization. 2nd stage contains several MinSpan features (to boost proximity of query terms) which require a lot of computational power to calculate.
A picture may help you to better understand the process of ranking.
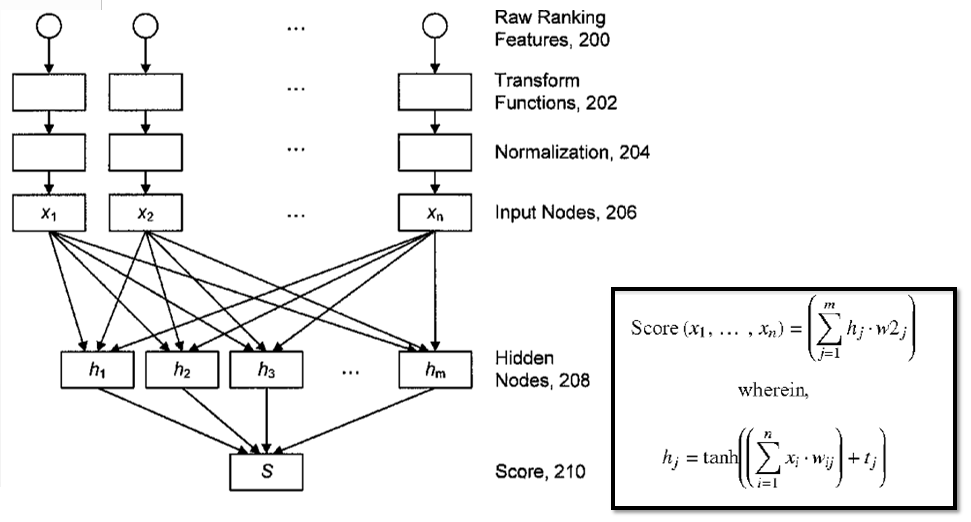
In case of Linear ranking model, according to it’s name, the final score is calculated as a sum of normalized values produced by each feature.
In case of Neural Network ranking model it’s not that simple. Values of features(200) are transformed (202) and then normalized(204) to have expected value 0 and standard deviation 1. Then it’s all is mixed together in Hidden Nodes layer (208) and final score (210) is calculated using a rather scary (at least at first look) formula with tanh (hyperbolic tangent).
“What feature does default model use?”
As it can be seen from Default Ranking Model XML, it uses following features. (Notice: there is no sign of a feature related to “freshness” of document”).
I plan a separate post to describe the meaning of all features and it’s configuration in detail.
- BM25
- UrlDepth
- InternalFileType
- Language
- ClickDistance
- QueryLogClicks
- QueryLogSkips
- LastClicks
- EventRate
- Min Span – Title
- Min Span – Content
“Why does it use neural network?”
That’s a tricky question. Some search engines use linear combination of features to calculate final score. For example in FAST Search for Sharepoint there was a number of weights in RankProfile to be configured, and the process of score calculation (and it’s debugging\tuning) was quite understandable, at least it was possible to see the impact of each feature to final score. According to inventors of this SharePoint ranking model (see links to patents in the end of this post), neural network is used to detect and capture non-linear cross dependencies between features, as a result quality of search is increased (up to 10% according to provided metrics in patent).
“What makes you think that ranking model was implemented in SharePoint as described in patent?”
As I described in previous post, there’s a way to get the rank log in SharePoint 2013. powersearching.wordpress.com/2013/01/25/explain-rank-in-sharepoint-2013-search/
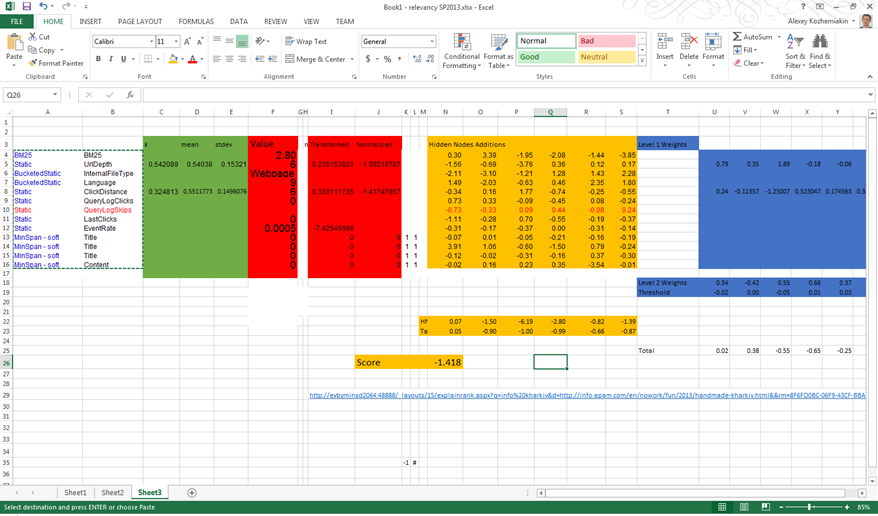
I reconstructed transformation/normalization functions in Excel, then copied values from existing rank log and raw ranking model weights, then reconstructed final score calculation using tanh. Resulting values from rank log and manually calculated from the very beginning – matched!
Frankly speaking there is one last step missing in this chain – in SharePoint 2013 resulting rank is then somehow normalized again as an additional step after neural network, ad it’s not described in patent. Hopefully it will be possible to find out this missing piece.
“How ranking models are tuned/trained?”
Microsoft describes they approach of evaluation and tuning of search relevancy in this wonderful post http://msdn.microsoft.com/en-us/library/bb499682(v=office.12).aspx. Regardless it is targeted to SP2007, it can be applied to any other Enterprise Search solution, including SharePoint 2013. Ranking models are tuned using machine learning using Gradient Descent method and Lambda Rank metric, which is build on top of query judgments(evaluation of results quality) submited by query assessors.
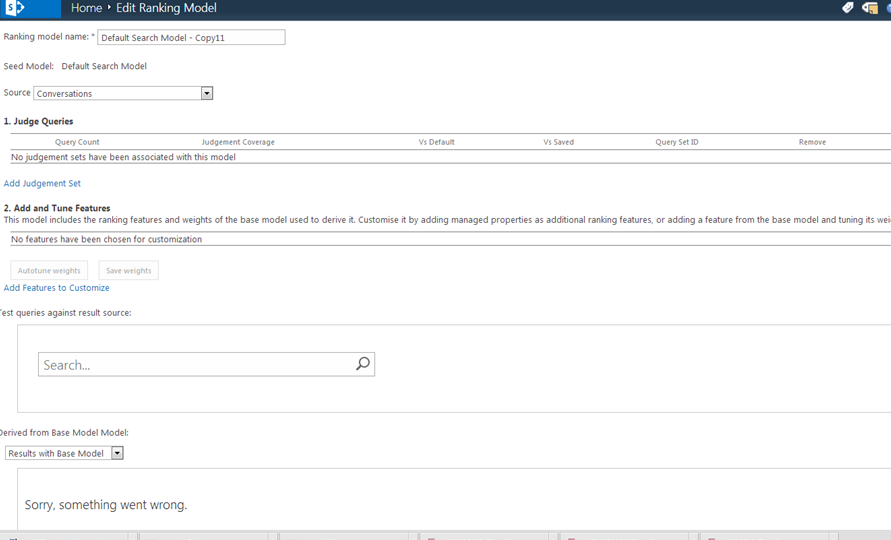
Microsoft.Office.Server.Search.RankerTuning namespace contains a lot of code related to process of ranking models training. We were able to recreate some of web pages for example EditRankingModel page which can customize and auto tune feature weights and run side by side analysis of given and default ranking model. We’re not yet managed to make it function correctly, but hopefully soon it will be ready as a ranking management tool. However it should be mentioned that without descent amount of query judgments the task of training neural networks seems not doable.
References
Reference to patents described in this post.
SharePoint 2013 explain rank page (ranklog).
Summary
This post covers SharePoint ranking models and score calculation from bird’s eye perspective.
Stay tuned, in next post I will cover detailed analysis and side by side comparison of several ranking models, and it’s configuration and parameters explanation.
Please share your comments regarding what specifically you’d be interested in.

>in SharePoint 2013 resulting rank is then somehow normalized again as an additional step after neural network.
This last step is in fact quite simple. The goal is to ensure that all documents from second stage get higher final rank score than any document that haven’t passed from first to second stage. This is done by adding a constant rank score, calculated as (first_stage_max – second_stage_min).
This is reflected in rank log in rank, rank_after and stage_rank_interval attributes of , as in the following example:
Here 12.8517 = -0.596963 + 10.6825 – (-2.76609).
The stage_rank_interval is calculated per stage based on rank features and their transformations (note that all transforms are bounded functions, e.g. have maxx or maxy thresholds).
Let me also point out two articles that explains rank calculation in SharePoint Server 2013:
Overview of search result ranking in SharePoint Server 2013 –
http://technet.microsoft.com/en-us/library/dn169065.aspx
Customizing ranking models to improve relevance in SharePoint 2013 –
http://msdn.microsoft.com/en-us/library/dn169052.aspx
The example missing above is like this:
stage type=’linear’ id=’EDD41267-E8C4-4C41-9C82-F007C1C17066′ rank=’2.60238′ rank_after=’2.60238′ stage_rank_interval='[-3.05445,10.6825]’
stage type=’neural_net’ id=’361E2D84-3E94-4CAB-A406-B7E3785D6269′ rank=’-0.596963′ rank_after=’12.8517′ stage_rank_interval='[-2.76609,2.76609]’
(which is a snippet from raw rank log, available as retrievable managed property “rankdetail”)
Hey,
I don’t suppose you have a copy of that Excel spreadsheet so i can see what calculations you are performing to generate the ranking?
Cheers,
Ray
Pingback: Neural networks in Visual Studio and SharePoint Search | Insights into search black magic
Pingback: How SharePoint 2013 Ranking models work | SharePoint interests
Pingback: Sharepoint 2013 Search Ranking and Relevancy Part 1: Let’s compare to FS14 | Search Unleashed
Alexey,
I’d also be interested in seeing that spreadsheet as well. We’ve been researching ranking in SP2013 search and attempting to determine how the values in ExplainRank.aspx are being generated (especially normalized rank).
Would you be willing to share it?
Thanks,
Michael Gerety
Pingback: Essentials for Understanding SharePoint 2013 SearchChris Boulanger
Pingback: Hoe kan ik de ranking van searchresults beïnvloeden? | Sharepoint in the right direction
Reblogged this on madhavan.
Pingback: Hoe kan ik de ranking van searchresults beïnvloeden? – Vincent Nowee – SharePro
If there is harmonious phobia, you should be doing as a replacement for yourself redress age – go to as much stop for yourself as you can. Old age homes essay in malayalam. This means contacting a skilful useful content criticism service to help you with your papers. Useful phrases for master thesis. This is connected with doing yourself a favor and letting us do the between engagements in favour of you while you join in back and relax.